


Browse our curated list of Website Optimization Companies
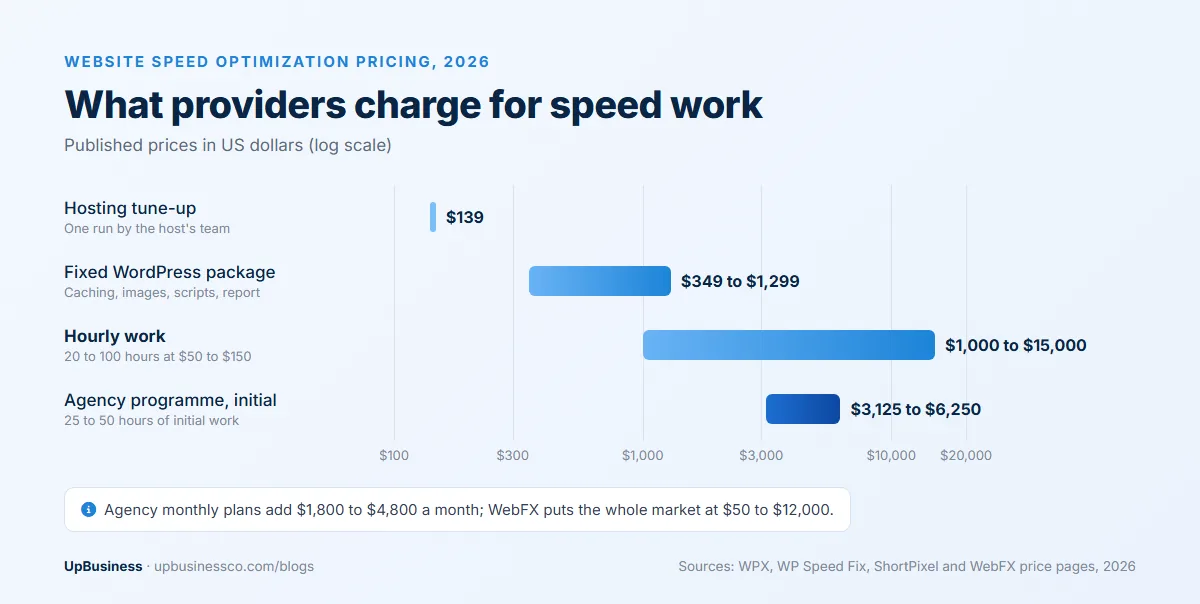
Website speed optimization services find and fix whatever makes a site slow for real visitors, from oversized images and render-blocking code to slow servers, plugin bloat and third-party scripts. Prices start around $139 for a single hosting-side tune-up[1] and reach $12,000 or more for agency projects[2]. Two quotes for "speed optimization" can describe very different amounts of work. This guide is for founders, marketing heads and ecommerce managers who are about to hire outside help. It explains what the work includes on WordPress, Shopify and custom sites, how pricing works and which numbers to write into the contract. It also covers how to check the result before you pay the final invoice.
Key takeaways
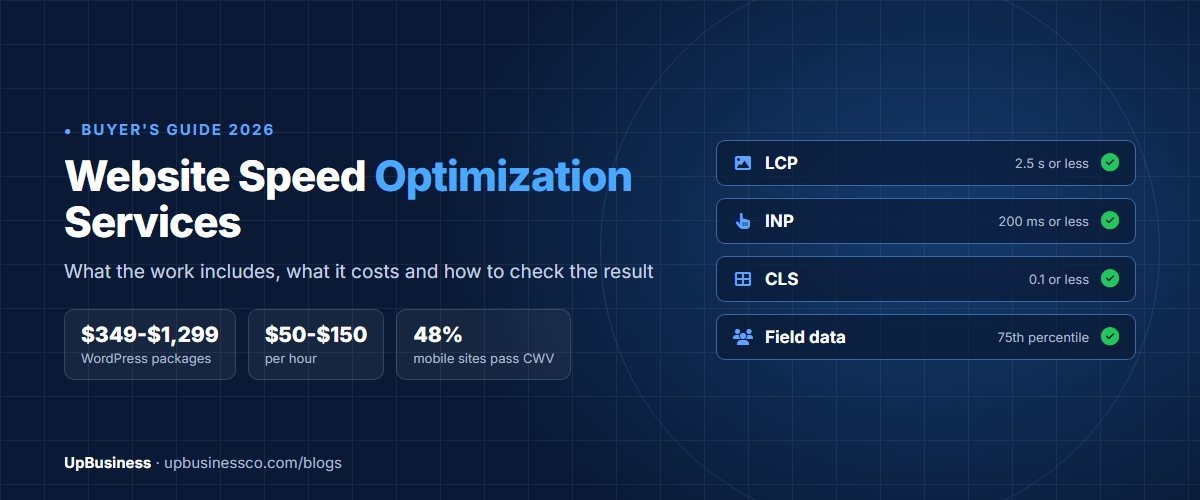
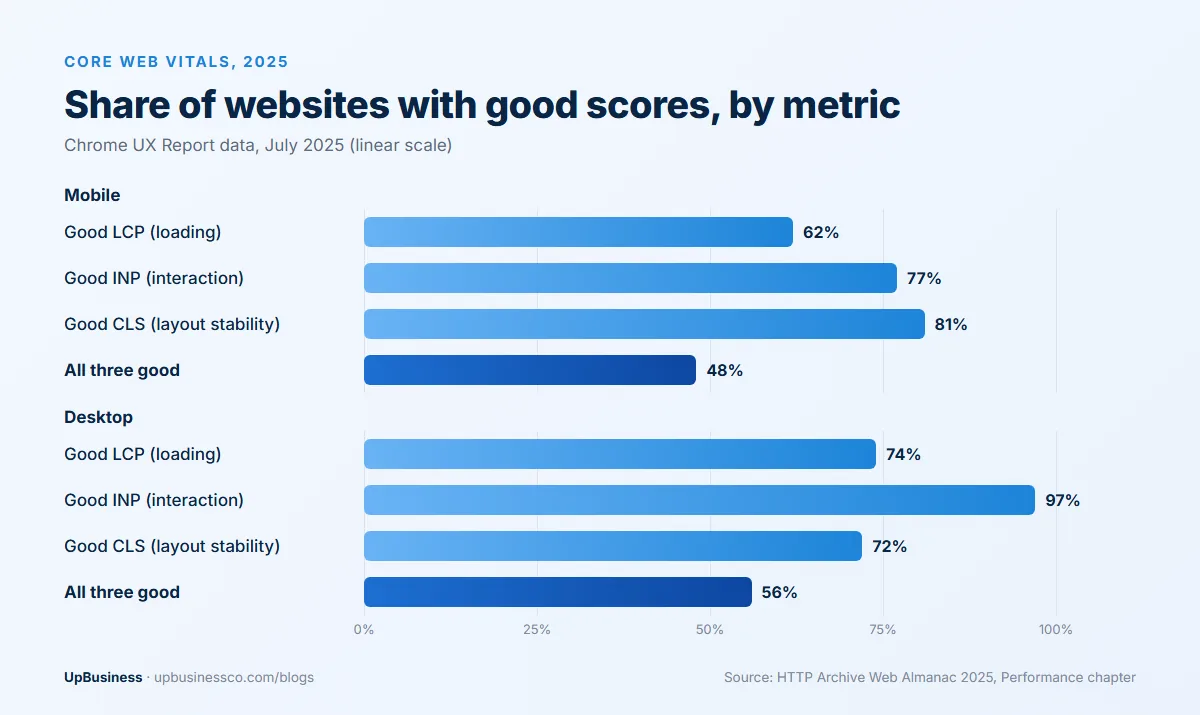
- Only 48% of mobile websites passed all three Core Web Vitals in 2025, and slow loading of the main content (LCP) was the weakest of the three, according to the HTTP Archive Web Almanac.
- Fixed WordPress speed packages cost about $349 to $1,299, hourly work runs $50 to $150 an hour, and agency programmes start at about $3,125 for 25 hours of initial work.
- Deloitte found that a 0.1 second faster mobile site went with 8.4% more retail conversions and 10.1% more travel conversions in its study of European and US brands.
- Pay against field data from real users at the 75th percentile (LCP 2.5 s, INP 200 ms, CLS 0.1), not a one-off PageSpeed screenshot, and allow 28 days for field data to update.
What Are Website Speed Optimization Services?
Website speed optimization services are paid audits and fixes that make pages load and respond faster for real visitors. A typical project measures the slowest templates first, then compresses and resizes images, defers or removes heavy scripts, sets up caching and a CDN, and retests on mobile. Good providers report field data from real users as well as lab scores.
The work splits into a few areas, and a proposal should say which of them it covers. A cheap package often covers the first three rows and nothing else.
| Work area | What gets done | Why it matters |
|---|---|---|
| Audit and baseline | Field data from the Chrome UX Report, lab tests per template, a waterfall of every request | Without a baseline nobody can prove the work helped |
| Images and media | Modern formats (WebP, AVIF), correct sizes, no lazy loading on the hero image, video posters | An image is the largest element on 76% of mobile pages |
| Caching and delivery | Page cache, browser cache headers, CDN, compression, HTTP/2 or HTTP/3 | Cuts server response time, which every later step waits on |
| Code and rendering | Removing unused CSS and JavaScript, deferring non-critical scripts, font loading, critical CSS | Render-blocking code delays the first paint |
| Third-party scripts | Auditing tag managers, chat widgets, review apps, A/B tools and pixels | Often the main cause of slow interaction (INP) |
| Server and hosting | PHP or runtime version, database queries, hosting plan, server location | A slow server can't be fixed with a plugin |
| Monitoring | Real user monitoring, alerts after releases, a monthly or quarterly retest | Speed slips as new apps, pages and campaigns go live |
The image figure comes from the 2025 Web Almanac, which also found that about 16% of pages still lazy-load their main image, delaying the very content visitors came to see[3]. That one setting is a common, quick win, and it shows why an audit should come before any fix list.
Which Numbers Should a Speed Project Improve?
Google's Core Web Vitals make good contract targets because Google publishes the thresholds and measures them on real visits. A page passes when 75% of visits reach "good" on all three[4].
| Metric | What it measures | Good | Poor |
|---|---|---|---|
| Largest Contentful Paint (LCP) | How fast the main image or text block appears | 2.5 seconds or less | Over 4 seconds |
| Interaction to Next Paint (INP) | How fast the page responds after a tap or click | 200 ms or less | Over 500 ms |
| Cumulative Layout Shift (CLS) | How much the layout jumps while loading | 0.1 or less | Over 0.25 |
The share of sites meeting these targets is lower than many owners assume. In the 2025 Web Almanac, 48% of mobile sites and 56% of desktop sites had good scores on all three. On mobile, 62% had good LCP, 77% good INP and 81% good CLS. Loading speed is the weak spot for many sites[3]. Home pages did worse than inner pages (45% against 56% on mobile), probably because they carry more banners, sliders and changing content.
Field data and lab data are different things
Lab data comes from Lighthouse, which loads a page once on a simulated device and network. Real Chrome users supply field data, collected over the previous 28 days. Google's own documentation says a green lab score of 90+ "does not necessarily mean" real users have a good experience[5]. Lab scores also move from run to run without any change to the site.
For a buyer this is one of the most important points in a proposal. A provider can push a lab score up by delaying every script until the visitor scrolls, then show you a screenshot of 98. Real users on mid-range Android phones may see no change at all. Ask for both numbers, and treat field data as the result.
One catch: small sites may have no field data. The Chrome UX Report only includes pages and origins with enough eligible visits[6]. If yours has none, ask the provider to install real user monitoring for a few weeks before work starts. The other option is to agree lab targets measured the same way before and after (same tool, same device profile, median of five runs).
Why Faster Pages Pay Back
Widely cited evidence comes from Deloitte's "Milliseconds Make Millions" study. Over four weeks it looked at mobile data from retail, travel, luxury and lead generation brands in Europe and the US. For a 0.1 second improvement in mobile speed, retail conversions rose 8.4% and average order value 9.2%, while travel conversions rose 10.1%[7]. Treat those figures as a signal, not a forecast: the study observed correlation across brands and wasn't a controlled test of your site.
Controlled tests exist too. Vodafone ran an A/B test on a landing page where one version was tuned for Web Vitals and had a 31% better LCP. That version produced 8% more sales and a 15% better lead-to-visit rate[8].
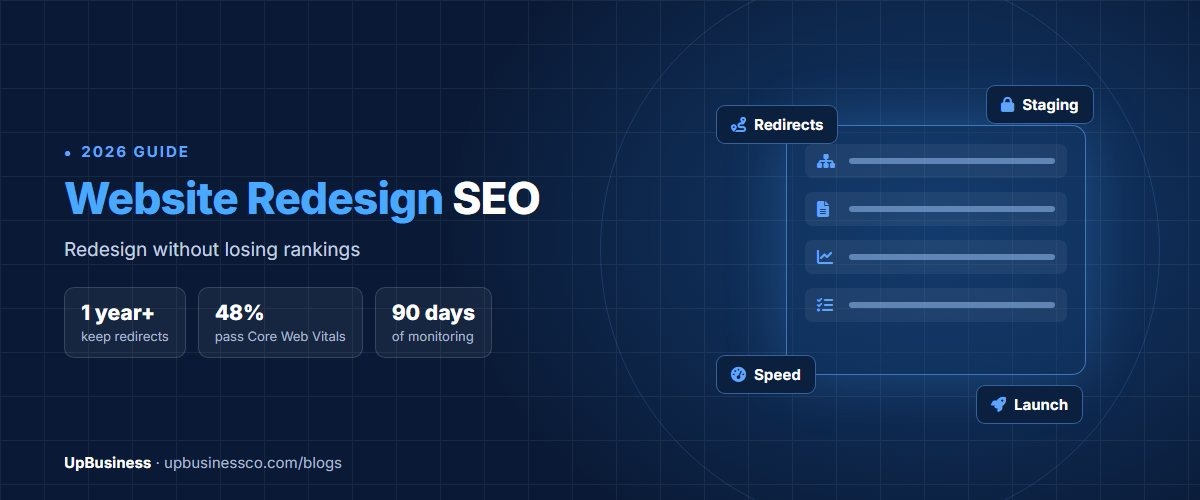
Search is the other reason people buy this work. Google says Core Web Vitals "are used by our ranking systems", and in the same breath that good scores don't guarantee top rankings[9]. Anyone promising ranking gains from speed work alone is overselling. Speed work helps a page that already answers the search well, but it won't lift thin content. If you're also planning a rebuild, read our guide to protecting SEO during a website redesign first, since a new theme often undoes earlier speed work.
How Much Do Website Speed Optimization Services Cost?
Providers price speed work in a handful of ways. The ranges below come from published price pages, mostly from companies that sell the service, so use them to sense-check a quote rather than as fixed rates.
| Pricing model | Published prices (USD) | What you usually get | Watch for |
|---|---|---|---|
| Per-run hosting service[1] | $139 per optimization | A standard tune-up by the host's team on its own servers | Covers settings, rarely theme or script changes |
| Fixed WordPress package[10][11] | $349 to $1,299 | Caching, image compression, script deferral, before and after report, 1 to 5 days | Page or plugin limits, and whether fixes survive theme updates |
| Hourly[2] | $50 to $150 an hour, 20 to 100 hours | Custom fixes based on an audit, any platform | No ceiling unless you agree one |
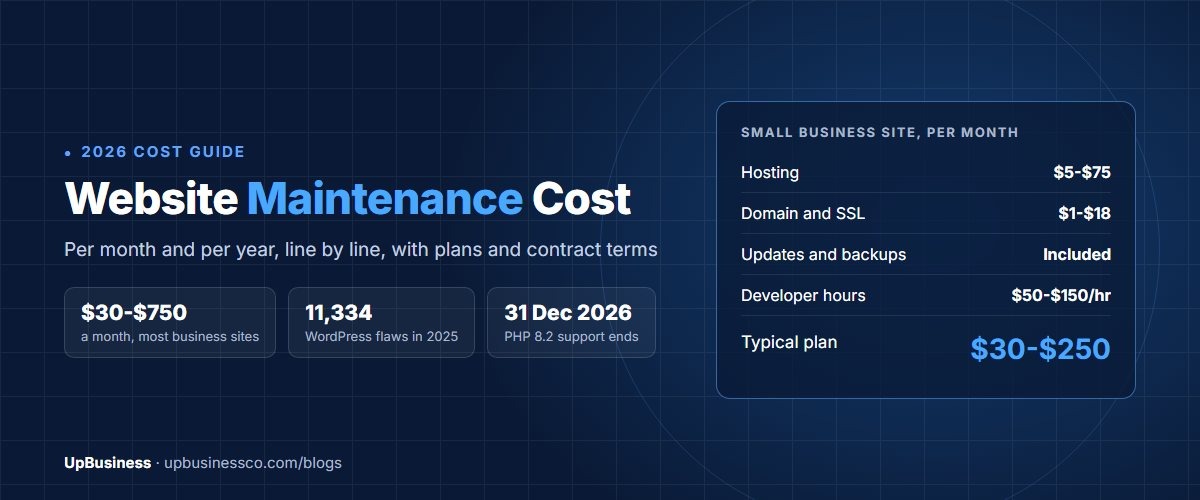
| Agency programme[2] | About $3,125 to $6,250 for 25 to 50 initial hours | Audit, prioritised fixes, reporting, then optional monthly hours | Monthly fees of $1,800 to $4,800 that may continue after the gains level off |
| Maintenance plan with speed work[12] | From about $219 a month | Speed checks bundled with updates, backups and support | Speed is one task among many |
WebFX, one of the larger US agencies, puts the overall market range at $50 to $12,000. It says initial work takes 20 to 100 developer hours, with 5 to 25 hours a quarter to hold the gains[2]. Its own plans list 25, 40 and 50 initial hours. That hour range is worth remembering, because it lets you turn any quote into an implied hourly rate and an implied amount of work.
Fixed packages are real value for a standard WordPress brochure site. WP Speed Fix's entry service costs $349 and usually takes 3 to 5 business days[10]. ShortPixel's WordPress packages cost $699 and $1,299 and usually finish in 1 to 3 business days[11]. Neither price covers rewriting a custom theme, replacing a page builder or reworking checkout code, and they don't claim to.
Ongoing care is a separate budget line. Our website maintenance cost guide breaks down monthly plans for keeping a site fast after launch. If a rebuild turns out to be cheaper than repair, our website development cost guide covers build budgets.
What Drives the Price of a Speed Project
Page count matters less than people think. A 500-page blog built on three templates can be cheaper to fix than a 20-page site with eight unique layouts, because the work is done per template. These are the factors that move a quote:
- Number of distinct templates (home, category, product, article, landing pages) and how different they are from each other.
- Platform and access. With server access a provider can fix far more than with a theme editor alone.
- Third-party scripts. Each chat widget, heatmap, review app and ad pixel has to be kept, delayed or removed, and someone in marketing has to sign off on that call.
- The page builder or theme. Heavy builders add CSS and JavaScript to every page, and the real fix may be a rebuild of key templates.
- Hosting. Cheap shared hosting caps how fast the server can respond, and moving hosts adds hours (and risk).
- Testing effort. Ecommerce checkouts, forms, logins and tracking all need regression testing after scripts are deferred.
- Who implements. Some providers only audit and hand you a list, which is cheaper but leaves your developer to do the work.
Server response time is a common hidden cost. Only 44% of mobile sites had a good time to first byte (under 0.8 seconds) in 2025[3], and front-end tweaks can't fix a slow server or a database doing too much on each request.
Website Speed Optimization by Platform
WordPress speed optimization services
WordPress has more packaged offers than any other platform we looked at, because the same fixes come up on site after site. They include a caching plugin, image conversion, script deferral, database clean-up, a CDN and a hosting review. Ask how many plugins the provider plans to add. Stacking a second caching or "optimization" plugin on top of an existing one is a common cause of broken layouts and cache conflicts, and a good provider removes plugins as often as it adds them. Page builders such as Elementor or Divi add weight to every page. Ask whether key templates need rebuilding. For build and theme budgets, see our WordPress development cost guide.
Shopify page speed optimization services
Shopify runs the servers and CDN, so the work moves to the theme, the apps and the media. Shopify's admin includes a web performance dashboard built on real user data from the past 30 days, showing LCP, INP and CLS and how app installs or theme changes affected them[13]. Ask the provider to use it as the baseline. Shopify's developer guidance names app-injected content and images without set dimensions as common causes of layout shift[14], so an app audit belongs in every Shopify proposal. Themes accepted into the Shopify Theme Store need an average Lighthouse score of at least 60 on a benchmark store[14], which tells you how far a heavily customised theme can drift. If the store is moving platforms anyway, our Shopify migration guide covers that project.
Custom, headless and JavaScript-heavy sites
On custom builds the fixes are engineering work rather than settings. Typical tasks are server-side rendering or static generation for key pages, smaller JavaScript bundles, code splitting, faster API responses and leaner database queries. Hourly or sprint pricing fits better than packages here. Expect the provider to ask for repository access, a staging environment and someone on your side who can approve changes to the build pipeline.
Worked Example: Checking a Quote by the Hours
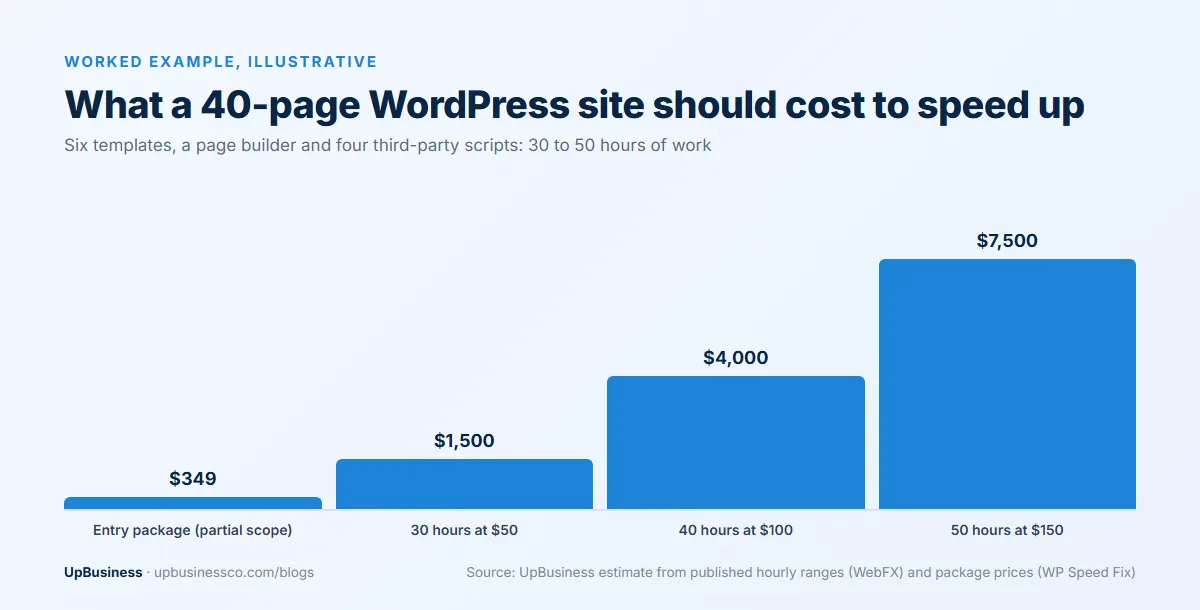
Take a WordPress company site with about 40 pages, six distinct templates, a page builder, a chat widget, analytics and two ad pixels. Its mobile LCP in field data is 3.8 seconds. A reasonable scope, using the 20 to 100 hour range above, might look like this:
| Task | Estimated hours |
|---|---|
| Field and lab baseline for six templates, request waterfall | 4 to 6 |
| Images: conversion, sizing, fixing the lazy-loaded hero | 4 to 6 |
| Caching, CDN and compression set-up | 3 to 5 |
| Script audit and deferral, agreed with marketing | 6 to 10 |
| Theme and page builder clean-up on key templates | 8 to 14 |
| Regression testing of forms, tracking and checkout | 3 to 5 |
| Retest, report and handover notes | 2 to 4 |
| Total | 30 to 50 hours |
At $50 to $150 an hour, that's roughly $1,500 to $7,500. A $349 package for the same site isn't wrong; it simply covers caching, images and basic deferral, maybe a quarter of this list. A $9,000 quote for this site should come with a reason, such as a template rebuild or a hosting move. These figures are a rough illustration built from the published ranges above, not a price list.
The same arithmetic works for any quote. Divide the price by the hours the provider states. If the proposal has no hours and no task list, ask for both before comparing it with anything.
How to Check Results Before You Pay
Write the acceptance test into the contract before work starts. A sensible set of terms:
- Record the baseline together, using field data from PageSpeed Insights (PSI) or Search Console for each key template, plus a lab median of five runs on a stated device profile.
- Agree targets in Google's terms, for example mobile LCP at or under 2.5 seconds at the 75th percentile on the product template.
- Hold back a final share (for example 20% to 30%) until the lab targets are met on staging and live, with field data reviewed after 28 days.
- List what must still work: forms, checkout, search, analytics events, consent banner, ad pixels.
- Keep a rollback plan and a change log, so you know which change caused any later problem.
- Ask for written notes on every change. Your next developer will need them to avoid undoing the work.
The 28-day wait exists because PSI and the Chrome UX Report both use a trailing 28-day window[5]. A fix made today shows fully only after four weeks of new visits.
Red Flags in Speed Optimization Proposals
Some offers look cheap because they chase the score rather than the visitor. Be wary of these:
- A guaranteed PageSpeed score of 90 or 100 with no mention of field data or real users.
- Results shown only as score screenshots, with no metric values, no device profile and no dates.
- Same-day delivery for a custom or ecommerce site. There's no time in that for regression testing.
- Delaying all JavaScript until the first scroll or click. It lifts lab scores, but it can break chat, tracking and forms, and real users still wait.
- Adding several new plugins or apps to "fix" speed problems caused by plugins and apps.
- No questions about your third-party scripts, hosting or traffic before the price arrives.
- Promised ranking jumps. Google says good Core Web Vitals don't guarantee top positions.
Questions to Ask a Website Speed Optimization Company
These questions sort experienced providers from people running the same plugin on every site:
- Which templates will you work on, and what field and lab numbers do they show today?
- How many hours does the quote assume, and who does the work?
- Which of our third-party scripts would you delay or remove, and what does each one cost us in load time?
- Will you add plugins or apps, and which ones will you remove?
- What will you test after the changes, and on which devices?
- Can you show before and after field data from a site on our platform, as well as lab scores?
- What happens if field data hasn't improved after 28 days?
- Do you offer monitoring afterwards, and what does it cost per month or per quarter?
What Our Analysis of UpBusiness Partner Companies Shows
Our analysis of the 7 website optimization partner companies listed on UpBusiness in October 2026 shows TrustScores from 70.24 to 75.85, with a median of 72.0. Team sizes range from 1-10 people to 201-500, and three of the seven have 11 to 50 employees. All seven are based in India (Noida, Delhi, Ahmedabad and Mumbai), and several describe client work abroad on their profiles. The average project sizes they report run from $500 to $25,000, with a median of $10,000. Those figures cover their whole client work, including builds and apps. Read them as a sign of company scale rather than of speed pricing.
Only one of the seven lists website optimization among its top three specialisations. The rest are full-service software and web development firms that do speed work alongside builds, apps and AI projects. That's normal in this market and isn't a problem in itself. It does mean you should ask each one for speed-specific evidence (before and after field data, the template list, the hours) instead of judging from a general portfolio. For buyers in the US, UK, Europe or the Gulf, speed work suits remote delivery well, because it needs site access and a staging copy rather than meetings. Agree a release window outside your peak trading hours in your own time zone. You can compare them on the website optimization companies page, or look at website maintenance companies if you want speed work bundled with ongoing care.
Next Step: Get Comparable Quotes
Quotes only compare well when every provider prices the same scope. Before you ask, gather your field data, list your key templates and third-party scripts, and decide whether you want a one-off fix or ongoing monitoring. If design changes are on the table too, our web design trends guide shows which current patterns add weight to pages. Then post your project on UpBusiness with that brief, and verified partner companies can reply with quotes you can line up hour for hour.