

Browse our curated list of Digital Marketing Companies
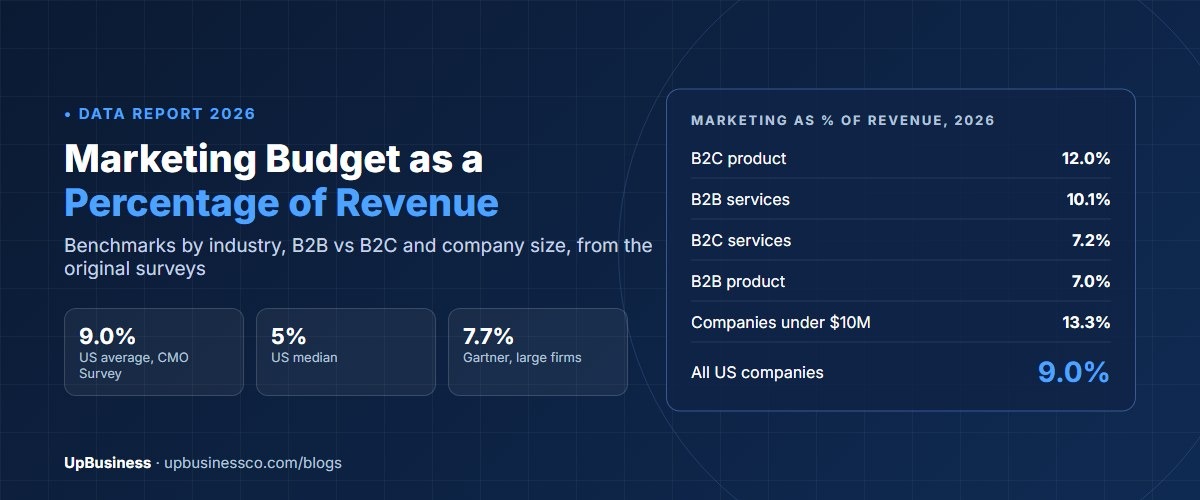
The average marketing budget as a percentage of revenue is about 8% to 9% in 2026. The CMO Survey's January 2026 edition puts it at 9.0% of revenue for US companies, with a median of just 5%. Gartner's 2025 survey of mostly large companies found 7.7%. The real range is wide: from about 5% for many B2B firms to 12% or more for consumer brands and young, fast-growing companies.
This report is for founders, CEOs, finance heads and marketing leaders setting next year's budget. We took the numbers from the original survey reports, not from blogs that repeat them, and we show the sample size behind each figure. You'll find benchmarks by industry, by B2B and B2C, by company size, the trend since 2021, four ways to set your own budget, and a worked example.
Key takeaways
- US companies spend a mean of 9.0% of revenue on marketing, but the median is 5%. A few high spenders pull the average up, so most companies spend less than the headline number.
- B2C product companies spend the most, about 12.0% of revenue. B2B product companies spend the least, about 7.0%.
- Smaller companies spend a bigger share. Firms under $10 million in revenue average 13.3%, while firms with $1 billion to $9.9 billion average 5.7%.
- Marketing is cut first when profits miss. Companies cut marketing in 45.4% of such cases, more often than any other expense.
What Percentage of Revenue Should Be Spent on Marketing?
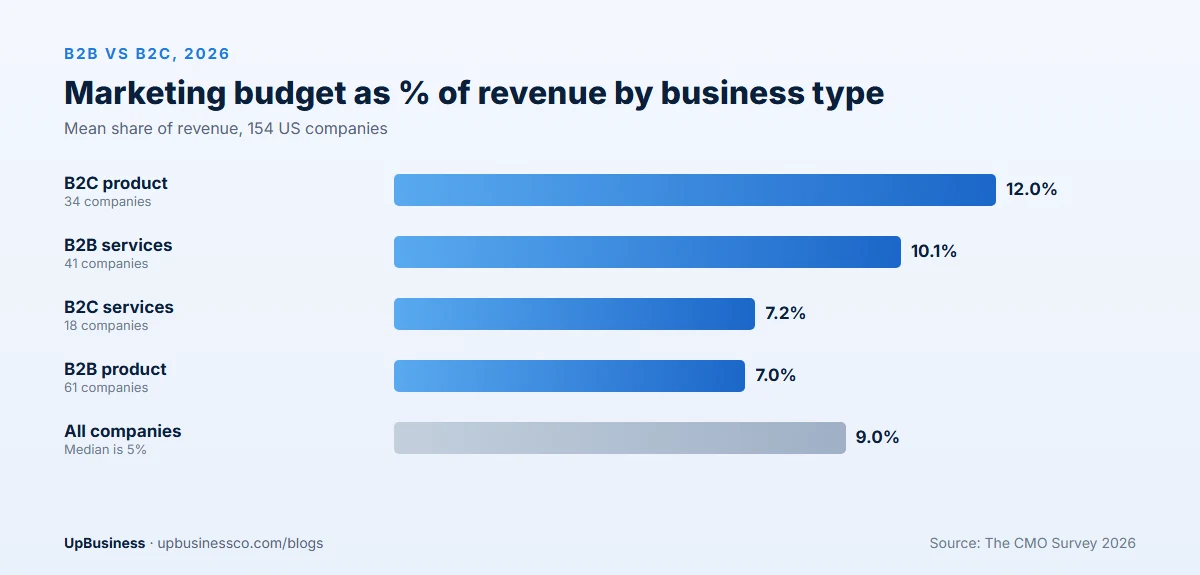
Most established companies should plan to spend 5% to 10% of revenue on marketing. Aim for 10% to 15% if you sell to consumers or have less than $25 million in revenue. The same goes if you want to grow fast or enter a new market. Stay near 5% if a sales team sells to a few large buyers, or if most sales come from repeat customers.
A percentage is a starting point, not a plan. The right number depends on your gross margin, how fast you want to grow and what it costs you to win a customer. We cover how to test it later in this report.
Marketing Budget as a Percentage of Revenue: 2026 Benchmarks
Two large surveys track this number every year. They ask different companies, so their results differ.
| Survey | Who was asked | Marketing as % of revenue |
|---|---|---|
| The CMO Survey, 2026 edition | Marketing leaders at 308 US companies, January 2026; 154 answered this question | 9.0% mean, 5% median |
| Gartner CMO Spend Survey, 2025 | 402 marketing leaders in North America, the UK and Europe, mostly companies with over $1 billion in revenue | 7.7% average; half reported 6% or less |
The CMO Survey is run by Duke University's Fuqua School of Business with Deloitte and the American Marketing Association[1]. It covers companies of every size, including many small ones, which spend a higher share. Gartner's survey leans toward large enterprises, which spend a lower share[2]. So both numbers are right for the companies they describe.
Notice the gap between the mean and the median. In the CMO Survey, answers ranged from 0% to 43% of revenue. The mean is 9.0%, but half of companies spend 5% or less. If you compare yourself only to the average, you may think you're underspending when you're actually typical.
Gartner's 2026 survey turned to how that budget is spent. It reported that CMOs now put 15.3% of their marketing budgets toward AI[3].
Marketing Budget as a Percentage of Revenue by Industry
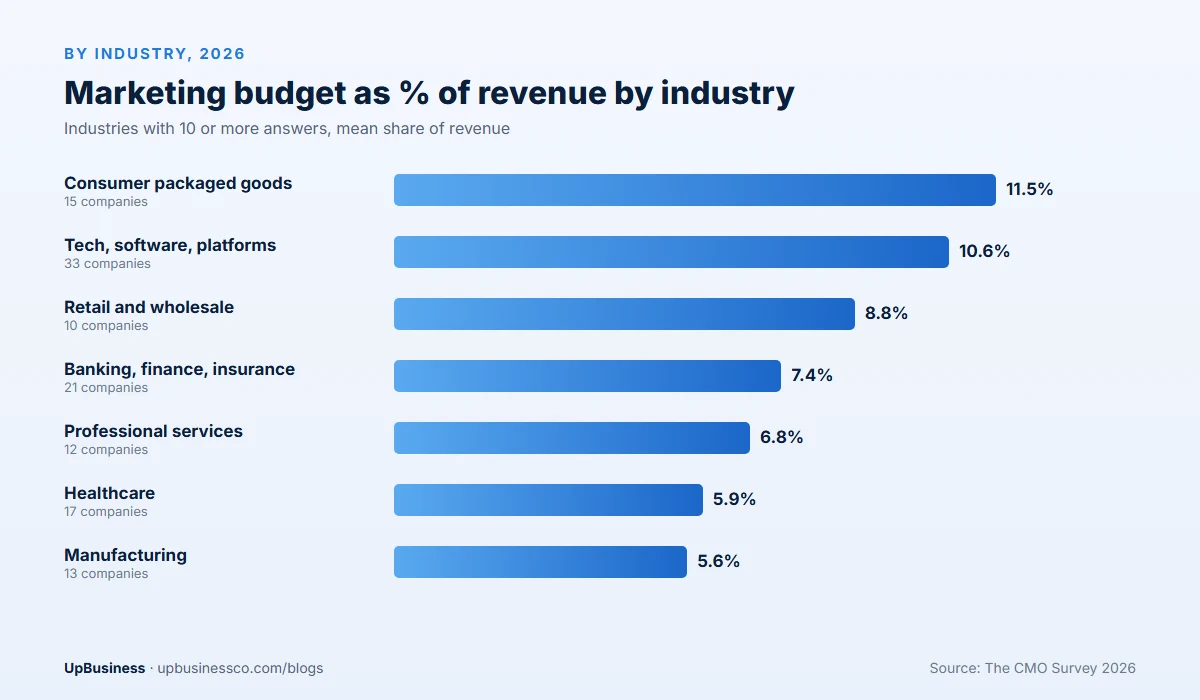
Here is the CMO Survey's 2026 industry breakout[4]. We show only industries with at least 10 answers in the main table, because smaller groups swing too much to rely on.
| Industry | Companies answering | Marketing as % of revenue (mean) |
|---|---|---|
| Consumer packaged goods | 15 | 11.5% |
| Tech, software and platforms | 33 | 10.6% |
| Retail and wholesale | 10 | 8.8% |
| Banking, finance and insurance | 21 | 7.4% |
| Professional services | 12 | 6.8% |
| Healthcare | 17 | 5.9% |
| Manufacturing | 13 | 5.6% |
| All companies | 154 | 9.0% |
The survey also reports industries with very few answers. Treat these as rough signals only:
| Industry | Companies answering | Mean |
|---|---|---|
| Education | 5 | 18.4% |
| Communications and media | 6 | 18.0% |
| Real estate | 4 | 12.6% |
| Consumer services | 3 | 11.0% |
| Energy | 4 | 7.1% |
| Pharma and biotech | 5 | 6.8% |
| Transportation | 3 | 3.8% |
| Mining and construction | 3 | 0.4% |
The pattern makes sense. Consumer goods and software companies compete for attention from many buyers, so they spend more. Manufacturers, healthcare providers and professional services firms often win work through relationships, referrals and sales teams, so marketing takes a smaller share. Gartner's 2025 survey found the same split: consumer products companies spent 9.7% of revenue, while IT and business services spent 5.8%[2].
B2B vs B2C Marketing Budget as a Percentage of Revenue
| Business type | Companies answering | Marketing as % of revenue | Marketing as % of total budget |
|---|---|---|---|
| B2B product | 61 | 7.0% | 7.0% |
| B2B services | 41 | 10.1% | 9.2% |
| B2C product | 34 | 12.0% | 13.8% |
| B2C services | 18 | 7.2% | 11.5% |
Source: The CMO Survey 2026[5]. B2B services firms, such as agencies, consultancies and software service companies, spend more than many expect, at 10.1% of revenue. That's because their product is expertise, and marketing is how they show it: content, events, case studies and search.
For B2B companies, the revenue percentage hides one thing. Much of the cost of winning a customer sits in the sales team, which most companies count separately. So a B2B firm spending 7% on marketing may spend far more on "sales and marketing" combined. When you compare yourself with public companies, check which number they report.
Marketing Budget by Revenue: Quick Lookup Table
Want a fast answer in dollars? Find your yearly revenue, then read across. The 5% column is the median company. The 9% column is the average. The 12% column is a B2C product company or a firm in a growth push.
| Yearly revenue | At 5% (median) | At 9% (average) | At 12% (high growth) | Per month at 9% |
|---|---|---|---|---|
| $500,000 | $25,000 | $45,000 | $60,000 | $3,750 |
| $1 million | $50,000 | $90,000 | $120,000 | $7,500 |
| $5 million | $250,000 | $450,000 | $600,000 | $37,500 |
| $20 million | $1,000,000 | $1,800,000 | $2,400,000 | $150,000 |
| $100 million | $5,000,000 | $9,000,000 | $12,000,000 | $750,000 |
Keep in mind that the total includes everything: staff, tools, ads, content, events and agency fees. A $1 million company with a $90,000 budget may spend half of it on one marketing hire. That leaves about $45,000 a year, or less than $4,000 a month, for ads, tools and outside help.
That's why small companies often get more from one strong channel than from many weak ones. Pick the channel where your buyers already look, such as search, LinkedIn or a marketplace, and do it well before you add a second.
Marketing Budget by Company Size
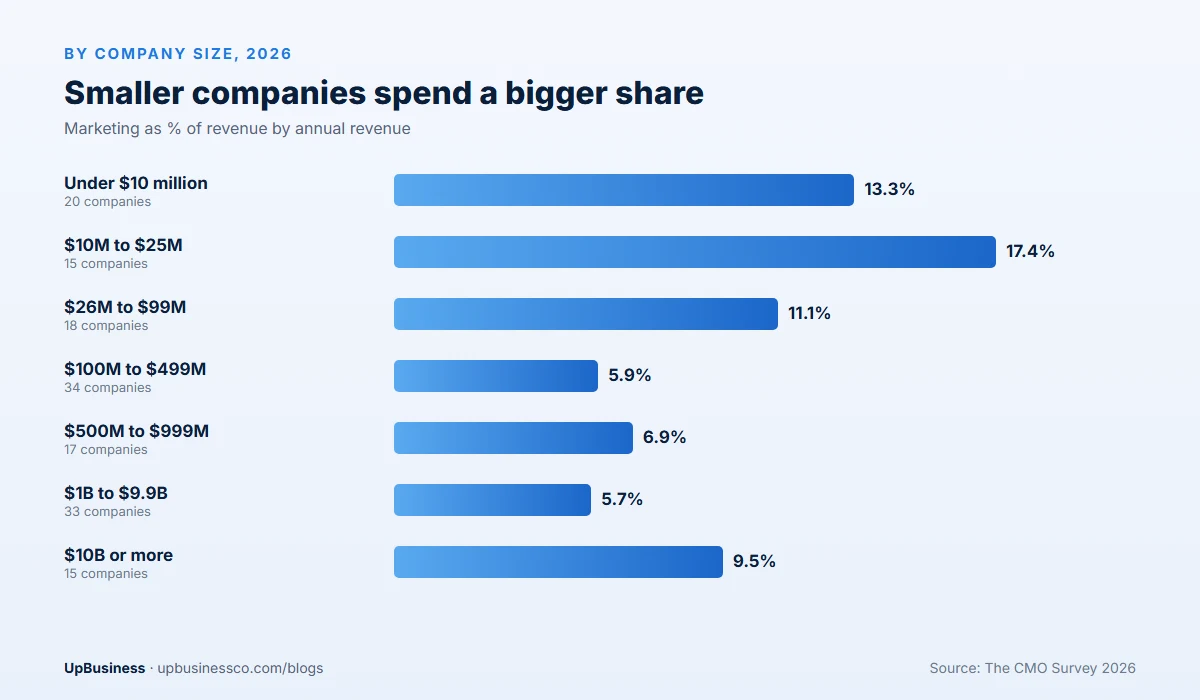
| Annual revenue | Companies answering | Marketing as % of revenue |
|---|---|---|
| Under $10 million | 20 | 13.3% |
| $10 million to $25 million | 15 | 17.4% |
| $26 million to $99 million | 18 | 11.1% |
| $100 million to $499 million | 34 | 5.9% |
| $500 million to $999 million | 17 | 6.9% |
| $1 billion to $9.9 billion | 33 | 5.7% |
| $10 billion or more | 15 | 9.5% |
Source: The CMO Survey 2026[4]. Companies under $100 million in revenue spend 11% to 17% of revenue on marketing. Companies between $100 million and $10 billion spend about 6% to 7%. The very largest companies rise again to 9.5%, often because they run big consumer brands.
The reason is simple. A small company has to build awareness from nothing, and each dollar of marketing is a bigger share of a small revenue base. A large company already has a known brand, repeat buyers and a sales team, so it can grow with a smaller share.
How Marketing Budgets Have Changed Since 2021
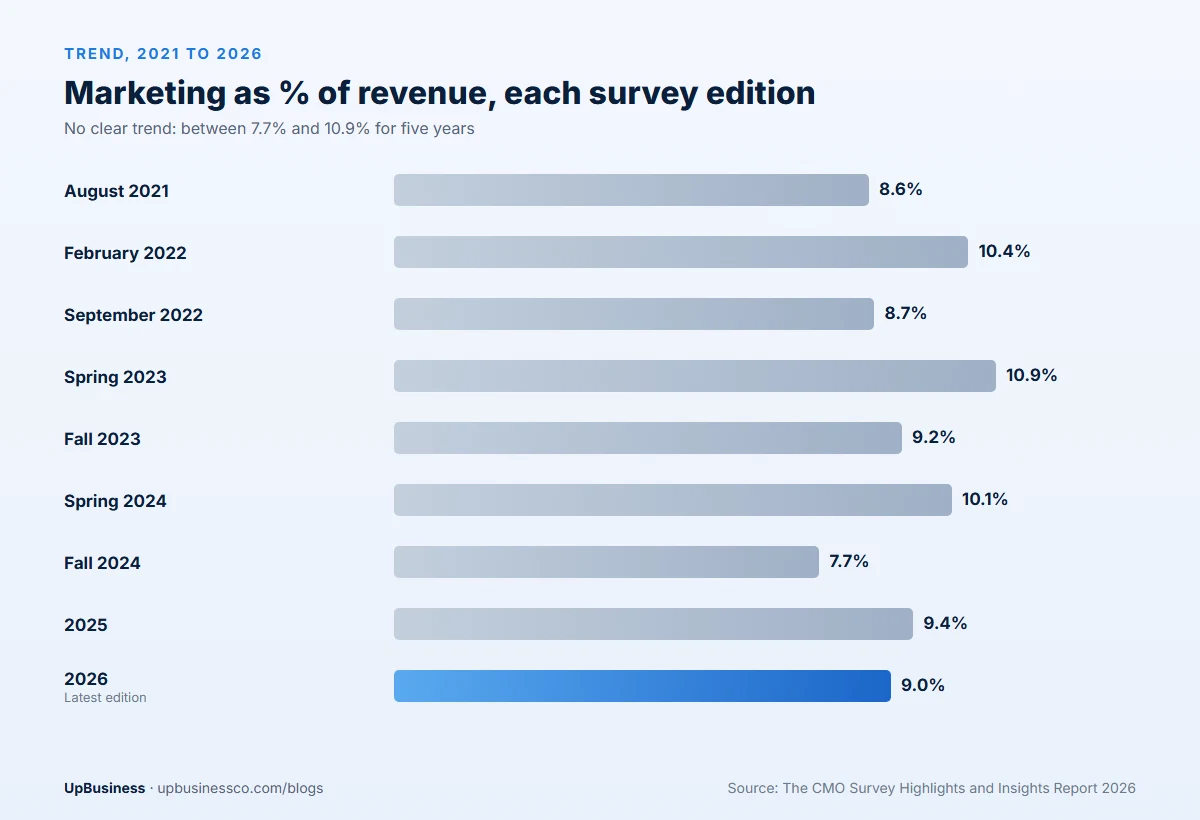
| Survey edition | Marketing as % of revenue | Marketing as % of company budget |
|---|---|---|
| August 2021 | 8.6% | 9.8% |
| February 2022 | 10.4% | 11.8% |
| September 2022 | 8.7% | 13.8% |
| Spring 2023 | 10.9% | 12.3% |
| Fall 2023 | 9.2% | 10.6% |
| Spring 2024 | 10.1% | 10.2% |
| Fall 2024 | 7.7% | 10.1% |
| 2025 | 9.4% | 11.4% |
| 2026 | 9.0% | 9.6% |
Source: The CMO Survey 2026 highlights report[5]. The share of revenue has moved between about 8% and 11% for five years, without a clear trend. The share of company budgets tells a sharper story: at 9.6%, it's the lowest since 2021. Overall marketing spending grew only 1.7% in the 12 months before the 2026 survey, the weakest growth since 2021, while digital marketing spending grew 8.2%.
Gartner's long-run view points the same way: budgets have settled near 7.7% of revenue for large companies after years of decline. In short, most companies are being asked to do more with a flat budget.
Is There a 7 to 8 Percent Rule for Small Businesses?
Many articles say the US Small Business Administration recommends spending 7% to 8% of revenue on marketing. We checked the SBA's current marketing and sales guide. It explains how to write a marketing plan and compare marketing costs with the revenue they bring in, but it doesn't set a percentage[6].
The 7% to 8% figure is still a fair middle point for an established small business. But the survey data shows small companies actually spend more, 13.3% for those under $10 million in revenue. A new company trying to grow fast may need 15% to 25% of revenue for a while, then lower it as repeat sales grow.
Four Ways to Set Your Marketing Budget
- Percentage of revenue. Pick a share based on the benchmarks above and multiply by expected revenue. Simple and easy to defend, but it ties spending to last year's results, not next year's goals.
- Objective and task. List your goals, the work needed to reach each one, and what that work costs. This is the most accurate method, but it takes time and honest cost estimates.
- Customer acquisition cost. Work back from the number of new customers you need and what each costs to win. This suits companies that know their numbers well.
- Competitive parity. Match what similar companies spend. Useful as a check, but your competitors may be wrong too.
Most good budgets combine two methods: a percentage of revenue to set the size, then objective and task to decide where it goes. Check the result against your customer acquisition cost.
Worked Example: A $5 Million B2B Services Company
Say a B2B services company expects $5 million in revenue next year and wants to grow 20%.
| Step | Calculation | Result |
|---|---|---|
| Benchmark budget | $5,000,000 × 10% (B2B services mean 10.1%) | $500,000 |
| New revenue needed | $5,000,000 × 20% | $1,000,000 |
| New customers needed | $1,000,000 ÷ $40,000 average first-year deal | 25 customers |
| Marketing cost to win them | 25 × $12,000 marketing cost per customer | $300,000 |
| Brand, content and retention | Keeping current clients and building the pipeline | $150,000 |
| Budget from the bottom up | $300,000 + $150,000 | $450,000, or 9% of revenue |
The two methods land close together: $500,000 from the benchmark and $450,000 from the bottom up. That's a sign the plan is sensible. If they had been far apart, say $500,000 against $1.2 million, the company would need to lower its growth target, raise its prices or find cheaper ways to win customers.
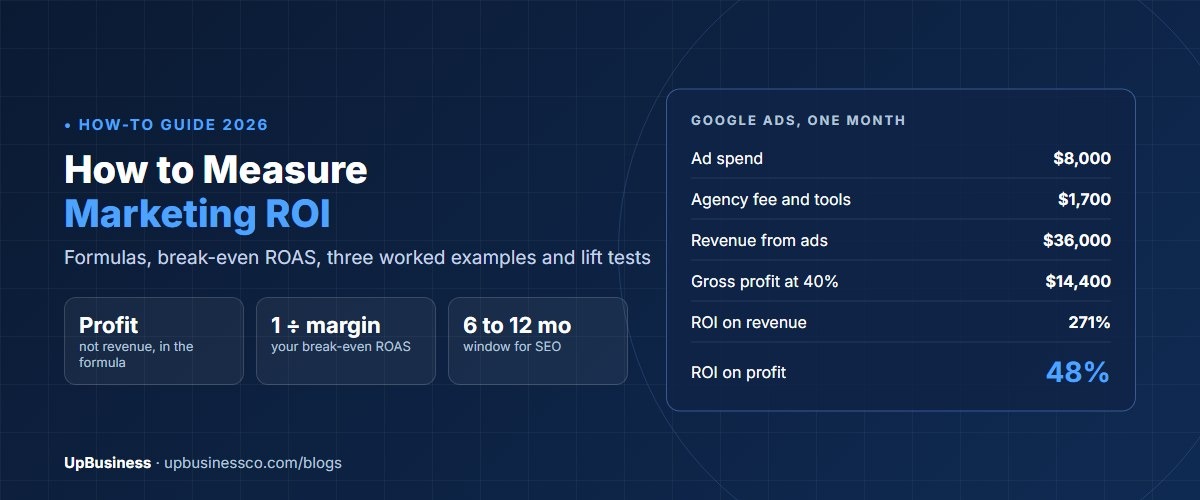
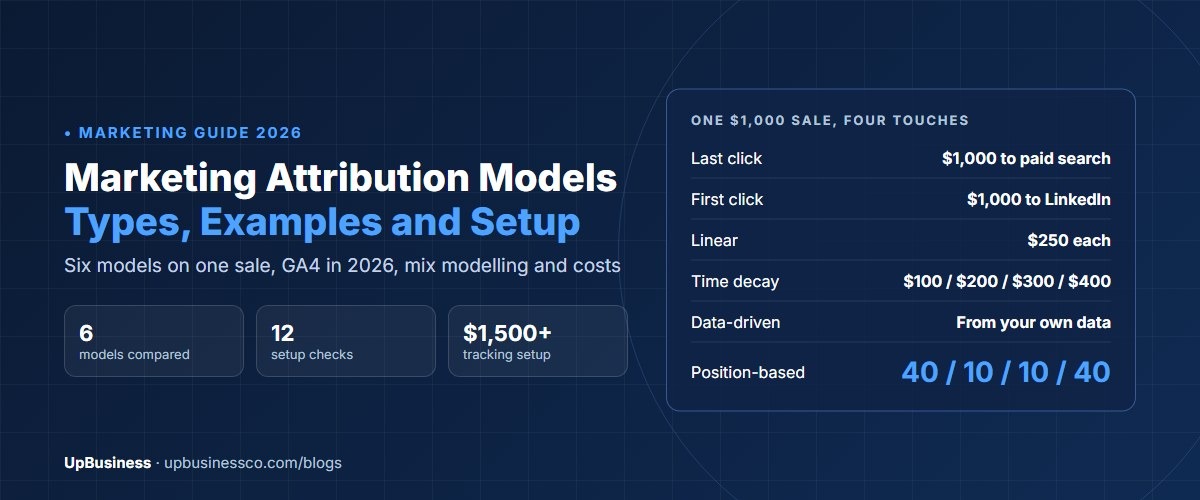
To check the cost per customer each quarter, use the formulas in our guide on how to measure marketing ROI. The marketing attribution models guide explains how to credit each channel fairly.
Where the Marketing Budget Goes
Once you know the total, the next question is how to split it. Here's what the surveys show:
- Paid media: about 30.6% of the marketing budget in Gartner's 2025 survey, or about 2.4% of company revenue[2].
- Social media: 14.3% of marketing budgets in the 2026 CMO Survey, after a dip in 2025[5].
- Agencies and outside partners: they carry out 33.6% of companies' digital marketing work on average, with a median of 25%[1].
- AI: 15.3% of marketing budgets in Gartner's 2026 survey[3].
- Customer acquisition vs retention: acquisition budgets are now 26.0% larger than retention budgets, up from 19.6% a year earlier[5].
That last point deserves attention. Keeping a customer usually costs less than finding a new one, yet budgets keep moving toward acquisition. If your repeat sales are strong, a bigger retention budget may give a better return.
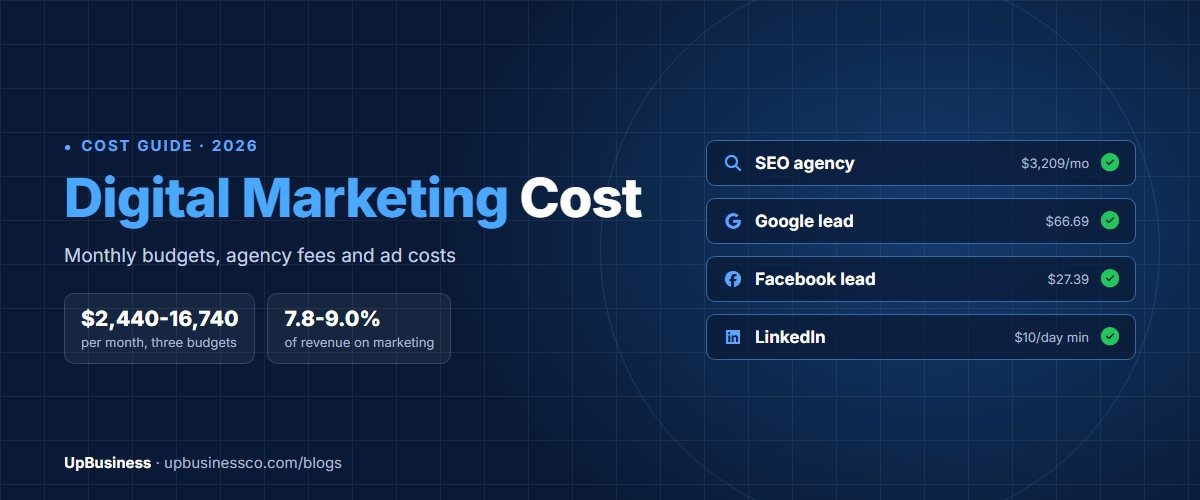
Plan to hand part of the budget to an agency? Our guides to digital marketing cost, SEO agency pricing and performance marketing agency pricing show typical fees. Our comparison of agency vs freelancer vs in-house helps you choose the model.
Marketing Budget for Startups
Startups break the benchmarks on purpose. Before they find steady demand, revenue is small, so even a modest marketing spend can be 20% to 50% of revenue or more. That's normal while you test channels, as long as the spend is tied to learning what works and you have the funding to cover it.
A practical approach for startups is to set a fixed monthly test budget, run small tests in two or three channels, and track the cost per customer for each. Move money to the channel that wins customers most cheaply, then grow it. Review the split every quarter, and stop paying for tests that haven't worked after two or three months. Our B2B SaaS marketing strategy guide shows how software startups plan this stage.
When to Spend More or Less Than the Benchmark
| Spend more than the benchmark when | Spend less when |
|---|---|
| You're launching a new product or entering a new market | Most revenue comes from a few long-term contracts |
| Your gross margin is high, so each sale pays back fast | Your gross margin is thin |
| Your cost per customer is falling as you spend more | Your cost per customer is rising with each extra dollar |
| Competitors are cutting back and ad prices are lower | You can't track what your current spend returns |
| You sell to consumers in a crowded market | Your sales team wins most deals through referrals |
When profits fall short, companies cut marketing 45.4% of the time. That's more often than any other cost[5]. Cutting is sometimes right. But cutting a channel that wins customers profitably only makes next year harder. Measure before you cut.
Common Mistakes When Setting a Marketing Budget
- Copying the average. The 9.0% mean is pulled up by a few heavy spenders. The median is 5%.
- Using last year's revenue only. Budget for the revenue you're aiming for, then check it from the bottom up.
- Forgetting hidden costs. Staff, tools, agencies, content and events all belong in the marketing budget.
- Spreading money too thin. Five channels with a little each rarely beat two channels done well.
- No measurement plan. Set up tracking before you spend, so you know what to keep next year.
- Hiring an agency on promises. Ask for results they've delivered at your budget level. Our list of digital marketing agency red flags helps.
Find a Digital Marketing Partner on UpBusiness
UpBusiness lists verified partner companies, mostly based in India and serving buyers worldwide. Every company has passed checks reviewed by our team: company details, registration and tax papers, the founder's identity, expertise and three client projects with evidence. Only companies with a TrustScore of 70 or more are listed.
- Post your requirement with your goals, channels and monthly budget.
- Get three partner companies matched to your budget, service and industry.
- Compare them side by side on our digital marketing page, and ask each how they would split your budget. Buyers pay nothing, and there's no commission on the project.